Skip to content
Vincent InferidoFull-Stack AI-First Developer & UI/UX Designer
// For SaaS & Web3 teams

Dashboards your team actually understands

Your data lives in Datadog, your database, the chain and three admin tools. I design and build one control room around your product: live health, the jobs and customers that matter, and the actions your team takes every day.

  • Fixed-scope plan before you pay
  • You own the code
  • Reply within 24 hours
  • Typical timeline: 4–10 weeks

Sound familiar?

Five tabs to answer one question

Metrics in one tool, logs in another, customers in the database, and on-chain data somewhere else.

Generic tools don't speak your language

CPU graphs are useful, but your team thinks in jobs, customers, transactions and incidents.

Admin work happens in raw SQL

Refunds, retries and fixes are done by hand in the database, which is slow and risky.

What I build for you

Live health & KPIs

Latency, errors, throughput and your business metrics in one view.

Service & dependency maps

See what depends on what, and where a problem really starts.

Logs, traces & incidents

Streaming logs with filters, traces and incident workflows.

Actions, not just charts

Retry jobs, resolve incidents, trigger deploys, with the right permissions.

Web3-ready

Wallet connection, on-chain data and multichain RPC with fallbacks.

Branded & shareable

Your name, colors and environments, for your team or your customers.

Live demo

Click through a live control room

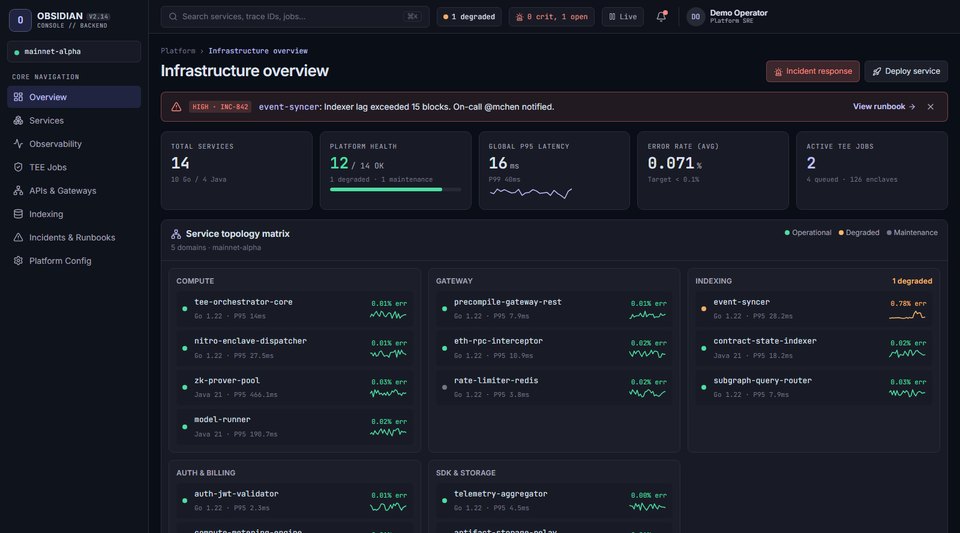
Obsidian Console is a working observability console for a Web3 compute platform: live service health, telemetry charts, a streaming log viewer, TEE job orchestration, incident response and ⌘K search. You can even rebrand it from its settings page.

Open the live demo

Concept with simulated data. For your team, it would connect to your real data sources.

Click through a live control room

Proof, not promises

How we'd work together

  1. 01

    Tell me what's broken

    A short message about your business and what you want to fix.

  2. 02

    Get a clear plan

    Screens, features, milestones and a fixed-scope quote, in plain language.

  3. 03

    See it take shape

    Designs you approve, then working software shown to you regularly.

  4. 04

    Launch & own it

    Live in about 4–10 weeks, with a bug-fix period and all code in your name.

Questions

Does a custom dashboard replace Datadog or Grafana?

No. It usually sits on top of them, using them as data sources, and adds your business context and actions in one place.

Can it connect to our database and on-chain data?

Yes. Dashboards can read from your database, monitoring APIs, chain RPCs and indexers, with read-only access where that's safer.

Who can see and do what?

Roles and permissions control which screens and actions each person has, and actions can be logged for auditing.

How long does it take?

Most dashboards and admin panels take 4–10 weeks, starting with the one screen your team needs most.

Helpful guides

Tech choicesStartupsPlanning

Supabase vs. Firebase: Choosing a Backend for Your MVP

A practical, non-hype comparison of Supabase and Firebase for founders and small teams, covering data model, security, pricing model, lock-in, and a simple guide to which one fits your product.

September 29, 2026 · 4 min read
Next step

Tell me what you'd like to fix. I'll reply within 24 hours.

No sales call needed. Send a short message, and you'll get questions, a suggested approach and, if it's a fit, a fixed-scope plan.