Best Monitoring Tools for Startups in 2026: Datadog vs Grafana vs New Relic (and When to Build Your Own Control Room)
Datadog, Grafana Cloud, New Relic, Better Stack and PagerDuty compared with real 2026 prices, plus when a custom operations dashboard makes more sense, with a live demo you can click.
 Vincent Inferido··11 min read
Research-based, not hands-on tested · prices and features checked on official sources on . See sources
On this page
It's 2:13 AM. Your phone lights up with a message from a customer: "Is your platform down?"
You open your laptop and start guessing. Is it the server? The database? That update someone shipped at 6 PM? Twenty minutes later you find it: one small service had been slowly failing for three hours, and nothing told anyone.
That's what "flying blind" feels like. Monitoring tools exist so it never happens: they watch your systems 24/7, alert the right person, and show exactly what broke. In this guide I compare the best monitoring tools for startups with real prices, show when a custom control room makes more sense, and let you click through a live one I built.
Quick picks: which monitoring tool fits you?
The 30-second comparison
| Tool | Free plan | Paid starts at | Pricing model | Best for |
|---|---|---|---|---|
| Datadog | Yes: up to 5 hosts, 1-day retention | $15/host/mo (Infra Pro, annual) | Per host + per GB/event | Teams that want everything in one place |
| Grafana Cloud | Yes: 10k metrics series, 50 GB logs, 50 GB traces, 3 users | $19/mo platform fee + usage | Usage-based | Budget-conscious technical teams |
| New Relic | Yes: 100 GB/month, 1 full user | $10 first user, then $99/user (Standard) | Per user + per GB over 100 GB | Small teams with lots of data |
| Better Stack | Yes: 10 monitors, 3 GB logs | $29/responder/mo (yearly) | Per responder + telemetry bundles | Uptime, status pages and simple on-call |
| PagerDuty | Yes: up to 5 users | $21/user/mo (annual) | Per user | On-call scheduling and alert routing |
Official list prices, checked Sep 29, 2026. See Sources.
The 5 tools, reviewed
Datadog
The everything platform, with a bill to match.
- Best for
- Growing teams that want infrastructure, application performance and logs in one polished product.
- Pricing
- Infrastructure Pro $15/host/month (annual) or $18 on-demand; Enterprise $23/host/month. APM from $31/host/month with infrastructure attached (annual). Log ingest from $0.10/GB, standard indexing $1.70 per million events (annual).
- Free plan / trial
- Free infrastructure tier for up to 5 hosts with 1-day retention.
- Watch out for
- Costs stack up: hosts × products × log volume. Set usage alerts and log retention rules from day one.
- Huge range of integrations and features
- Polished dashboards and strong correlation between metrics, traces and logs
- One vendor for most monitoring needs
- Bills grow quickly as hosts and logs grow
- Pricing has many moving parts
Verdict: The safest "just works" choice if budget allows. Model your costs at 10× today's size before you commit.
Grafana Cloud
Open-source power with a genuinely useful free tier.
- Best for
- Technical teams comfortable with a bit of setup who want to keep costs low.
- Pricing
- Free $0. Pro $19/month platform fee plus usage (for example metrics $6.50 per 1k series, logs $0.40/GB written). Enterprise from a $25,000/year commitment.
- Free plan / trial
- Free forever with 10k active metrics series, 50 GB logs, 50 GB traces, 3 active users and 14-day retention.
- Watch out for
- Usage pricing needs watching, and the flexibility means more setup decisions for your team.
- Very generous free tier
- Built on open-source standards (less lock-in)
- Pro retention of 13 months for metrics
- More hands-on than all-in-one tools
- Usage-based costs can be hard to predict at first
Verdict: The best starting point for most budget-conscious startups with an engineer who enjoys tuning dashboards.
New Relic
Pay mostly for people, not data (up to 100 GB).
- Best for
- Small engineering teams sending lots of telemetry data.
- Pricing
- Free tier includes 100 GB/month of data. Beyond that $0.40/GB (Original data). Full platform users on Standard cost $10 for the first and $99 each for additional users (max 5). Core users $49/user. Pro full platform users $349/user/month (annual).
- Free plan / trial
- 100 GB of data ingest per month, unlimited basic users and one free full platform user.
- Watch out for
- Full-platform seats are the main cost. Decide who truly needs full access versus basic or core access.
- 100 GB free every month goes a long way for small teams
- Broad feature set on one platform
- Unlimited free basic users for read-only viewers
- Full-user pricing jumps sharply on Pro
- Seat planning matters as the team grows
Verdict: Great for small teams with lots of data. Keep full-platform seats to the people who need them.
Better Stack
Uptime, logs, status pages and on-call, without the complexity.
- Best for
- Startups that want to know instantly when something is down and tell customers clearly.
- Pricing
- Responder licence $29/month billed yearly ($34 monthly); team members with telemetry access $0. Telemetry bundles from $45/month (Nano, 40 GB each of logs, traces and metrics). Extra 50 monitors $25/month.
- Free plan / trial
- Free for personal projects: 10 monitors, 1 status page, 3 GB logs and 3 GB traces (3-day retention).
- Watch out for
- Deep application tracing is lighter than the big platforms, so check it covers what you need.
- Friendly, fast setup
- Status pages included, great for customer trust
- On-call scheduling included with responder licences
- Fewer advanced analytics than Datadog or New Relic
- Short retention on the free tier
Verdict: The easiest way to stop learning about outages from your customers.
PagerDuty
The industry standard for "who gets woken up, and when".
- Best for
- Teams that already collect monitoring data and need reliable on-call and escalation.
- Pricing
- Free for up to 5 users. Professional $21/user/month (annual) or $25 monthly. Bundled platform plans start at $2,800/year.
- Free plan / trial
- Free for up to 5 users with 1 on-call schedule and 1 escalation policy.
- Watch out for
- It routes alerts; it doesn't collect metrics or logs. Pair it with a monitoring tool.
- Mature on-call scheduling and escalations
- Integrates with nearly every monitoring tool
- Post-incident reviews on paid plans
- Another subscription on top of monitoring
- Advanced automation sits in higher tiers
Verdict: Add it when your team is big enough that "who's on call?" becomes a real question.
What it really costs: a 10-server startup with 3 engineers
Here's a rough monthly bill using the list prices above. It's a simplified example with light usage and annual billing:
| Setup | Monthly estimate | How it's calculated |
|---|---|---|
| Grafana Cloud Pro | from $19 + usage | Platform fee; free allowances cover light usage |
| Better Stack | ~$132 | 3 responders × $29 + Nano bundle $45 |
| New Relic Standard | ~$208 | $10 + 2 × $99 full users; data within 100 GB free |
| Datadog (Infra Pro + APM) | ~$460 + logs | 10 hosts × $15 + 10 hosts × $31 |
| + PagerDuty (optional) | +$63 | 3 users × $21 |
Before tax. Real bills depend heavily on log volume, retention and number of hosts, so treat these as starting points, not quotes.
When a custom control room makes sense
Off-the-shelf tools are brilliant at generic questions: CPU, memory, error rates, uptime. What they don't know is your business.
A custom operations console (a "control room") sits on top of those tools and shows what your team actually talks about:
- A logistics company: shipments stuck, drivers late, deliveries at risk
- A clinic or booking business: no-shows today, double bookings, failed payments
- A SaaS company: customers hitting errors, failed sign-ups, stuck background jobs
- A Web3 or AI platform: jobs queued, enclaves attested, indexers lagging behind the chain
It makes sense when:
- Your team juggles several dashboards to answer one simple question
- Non-engineers need visibility: operations, support or management
- Your business has its own concepts (jobs, bookings, shipments) that generic tools don't understand
- You want actions, not just charts: resolve, retry, deploy or escalate from one place
It does not replace Datadog or Grafana. It uses them as data sources and turns their numbers into decisions.
See one in action: Obsidian Console
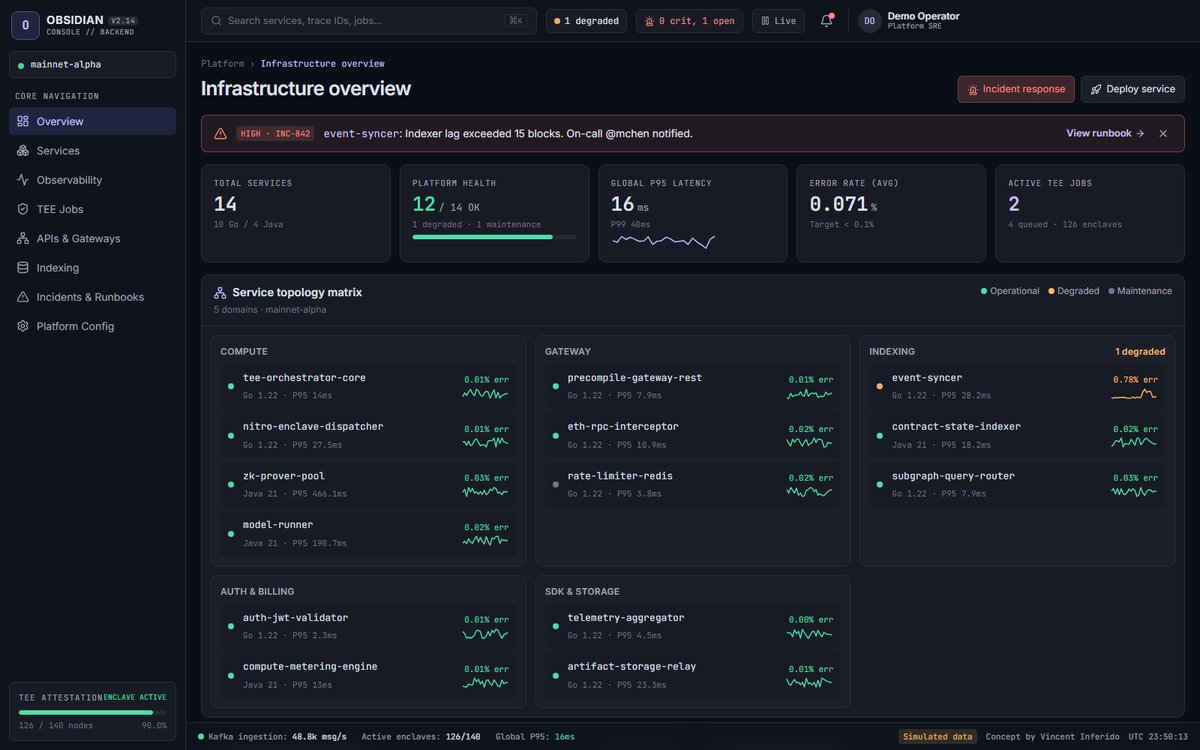
To show what this looks like, I designed and built Obsidian Console, a live, clickable control room for a Web3 compute platform. It runs on simulated data so anyone can try it safely.
What you can do in the demo:
- Spot problems instantly: a service topology matrix with live health dots and latency sparklines
- Investigate: live throughput and latency charts, a distributed trace waterfall and a streaming log viewer with filters
- Act: dispatch a job and watch it move from queued to running to attested, acknowledge and resolve incidents, start a canary deploy
- Find anything fast: press Ctrl+K (or ⌘K) to search services, jobs and incidents
- Make it yours: open Platform Config to change the name, colors and environments, then copy a share link
For a real business, the same interface would connect to your actual data (for example Prometheus, Grafana, Datadog or your own database) and show your team's own workflows.
How to choose in 4 questions
- How technical is your team? Hands-on engineers can get far with Grafana Cloud. Less time for setup points to Datadog, New Relic or Better Stack.
- What grows fastest: servers, data or people? Datadog prices per host, New Relic mainly per user, and Grafana and Better Stack by usage.
- Who needs to see what? If operations or support staff need visibility, plan for a simple, business-friendly view.
- Do you need actions, not just charts? If your team keeps switching tools to do something, a custom console pays off.
FAQ
What is the best monitoring tool for a small startup?
For most budget-conscious startups, Grafana Cloud's free tier or New Relic's 100 GB free tier is the best starting point. If you want the most complete all-in-one platform and budget allows, Datadog. If uptime alerts and a status page matter most, Better Stack.
How much does Datadog cost for a startup?
Infrastructure Pro is $15 per host per month billed annually ($18 on-demand), and APM starts at $31 per host per month with infrastructure attached. Logs are priced separately by volume, so real bills depend on your usage.
Is Grafana Cloud really free?
Yes, the free tier includes 10k active metrics series, 50 GB of logs, 50 GB of traces and 3 active users with 14-day retention. The Pro plan adds a $19 monthly platform fee plus usage beyond the included amounts.
Do I need PagerDuty if I already have monitoring?
Not always. Many monitoring tools include basic alerting, and Better Stack includes on-call scheduling. PagerDuty becomes valuable when you have rotations, escalations and several teams.
What is a custom operations dashboard?
It's an internal "control room" built around your business: it pulls data from your monitoring tools and database and shows your own workflows (jobs, bookings, shipments) with actions like resolve, retry or escalate, in one place.
Does a custom dashboard replace Datadog or Grafana?
No. It usually sits on top of them, using them as data sources, and adds your business context and actions for your whole team.
The bottom line
- Want everything in one place? Datadog.
- Watching the budget? Grafana Cloud or New Relic's free tier.
- Need uptime alerts and a status page fast? Better Stack.
- Growing on-call team? Add PagerDuty.
- Your team speaks in jobs, bookings or shipments, not CPU graphs? That's when a custom control room earns its keep.
Pick one tool this week, set up alerts for the two or three things your customers would notice first, and never find out about an outage from a 2 AM message again.
Want a control room built around your business? Try the Obsidian Console demo, then send me a message about the dashboards your team juggles today. You can also estimate your project in under a minute.
Sources
Prices and features were checked on these official pages on September 29, 2026: